Frequency Distribution
Overview of Frequency Distribution
In our daily lives, we collect data for a variety of reasons. Data is a collection of information or a representation of facts or topicIdeas that may be further processed. Weather forecasting, record keeping, dates, and times are all linked to data gathering. We need to analyze how times they have occurred. We need to arrange and understand these pieces of information through our assessment. This way we would know what these pieces of information are saying to us. Hence, we use the concept of frequency distribution.
What is Statistics and why is it used?
Statistics is the study of the gathering, presentation, analysis, organization, and interpretation of observations or data. Predictions regarding the nature of data may be established using statistics based on prior data. Statistics are advantageous for analyzing and observing huge amounts of data. The frequency distribution is a statistical concept that pertains to data management. The word frequency refers to the regularity with which something happens, whereas distribution refers to the act of splitting and sharing something.
Definition of Frequency Distribution
The frequency distribution plot depicts the distribution of frequencies throughout the data. It is a representation, either tabular or graphical, of the number of observations included within a certain period.
In other words, the frequency distribution is used to arrange the data gathered into tables. The data might include grades earned by students, temperatures in various locations, or points earned during a volleyball match, for example. Following data gathering, we must present data in a relevant way to facilitate comprehension. Organize the data such that all of its characteristics are summarized in a table. This phenomenon is referred to as “frequency distribution.”
Elements of frequency distribution
The following are the words used to describe the frequency distribution:
Data Presentation: After gathering data, it is arranged briefly in tabular form in order to analyze its characteristics. This arrangement is referred to as data presentation.
Observation: The term "observation" refers to each item in the provtopicIded data that is gathered as a numerical value.
Frequency: The frequency of a given observation is defined as the number of times it occurs.
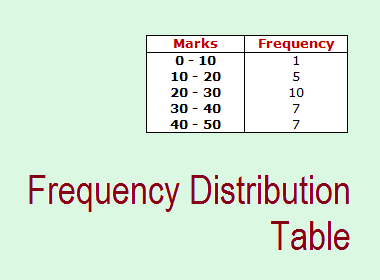
Frequency Distribution Table: This is one way to see data. It includes the observations and the frequency with which they occur.
Procedure for Producing a Frequency Distribution Table
Sort the data provtopicIded in ascending order.
Additionally, determine the frequency of each data value.
ConstopicIder the data value and frequency as the table's two columns.
In the table, record the frequency of each data value.
A Frequency Distribution Example
1. Illustration problem on frequency distribution 1.
Assume that the runs scored by the Indian cricket team's 11 players in a match are as follows:
35, 75, 13,11, 25, 46, 67, 56, 01, 33, 18.
Indicate the frequency with which each player appears?
Solution:
In light of this,
35, 75, 13,11, 25, 46, 67, 56, 01, 33, 18 are the runs made by the cricket team's 11 players in a match.
By ascending the data, we get the observations as
01, 11, 13, 18, 25, 33, 35, 46, 56, 67, 75.
We discover that each value happened exactly once.
The data above may be represented in tabular form, with the frequency of each observation indicated. This is referred to as a frequency distribution.